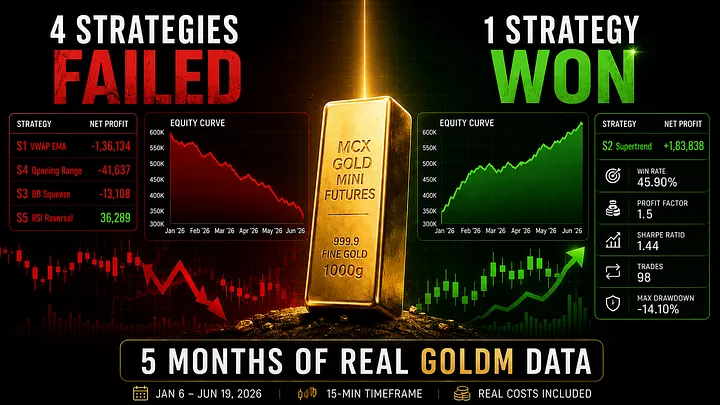
I have tested 5 intraday strategies on MCX Gold Mini Futures. Guess what? Only one made the money. The winners turned 3 lakh into 4.84 lakh in 5.5 months, and the loser burned 27% of their capital.
I have been trading GOLDM on Zerodha for a couple of years now. Mostly discretionary, watching the chart, investing when something “looks right,” and then cutting losses when the stress got too high. Sounds familiar?
I decided to stop guessing last January and spent time measuring things. I wanted to figure out which intraday setup on Gold Mini actually shows a real statistical edge, not some YouTube hype or curve-fit backtest from some outdated data. I want real numbers from a real live market.
So, I built a complete algo trading pipeline in Python — pulling live data through Zerodha’s MCP API. It generates indicators running 5 different strategies and producing a full backtest report.
Here’s what I built, found and where I got burned.
What is Zerodha MCP and Why I used it for GOLDM Algo Testing
If you have previously used Kite API before, MCP (Model Context Protocol) is the new way to connect trading tools, including AI coding assistants directly to your Zerodha account. I could just make a single API call to pull historical candle data for any MCX contract, rather than downloading CSVs or writing a login flow. No token juggling.
The pipeline that I built looks like this:
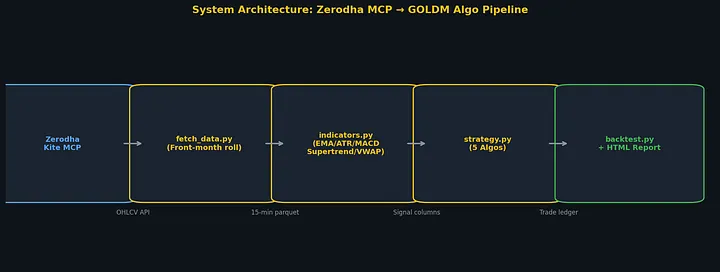
The Complete data flow from Zerodha’s servers to trade ledger in 4 steps
The code is split into Clean modules:
fetch_data.py— pulls OHLCV (Open, High, Low, Close, Volume) candles for each active GOLDM monthly contract and handles the front-month roll (switching to the nearest liquid contract)indicators.py- it computes 12 indicators natively in pandas/numpy (does not depend on pandas -ta since it doesn’t install on Python 3.10).backtest.py- calculates key performance metrics including Sahrpe Ratio, Calmar Ratio, Profit Factor, Maximum Drawdown (Max DD).
The one thing I figured out quickly was that MCX does not provide you continuous intraday data. You cannot just say “give me 15-min GOLM candles for the past 2 years.” The data is available, contract by contract, so you have manually stitch together the front-month contracts yourself.
def build_front_month(frames: dict[str, pd.DataFrame]) -> pd.DataFrame:
The build_front_month() function picks the nearest-expiry liquid contract at each timestamp. Liquidity = volume-weighted, liquidity is measured using trading volume so thin near-expiry contracts don’t dominate.
This roll logic took me an entire evening. Nearest expiry contract wins but once its volume falls under 20% of the next contract’s, in which case the roll has already happened.
The 5 Strategies that I Tested.
These are not invented by me. They are the five most common intraday set-ups applied to commodities, each representing a different market hypothesis.
- S1 — VWAP EMA Pullback: You enter when price crosses VWAP (Volume Weighted Average Price) in the same direction as the EMA9 (Exponential Moving Average 9- period) trend. It’s a classic mean-reversion trade which is well used level
- S2 — Supertrend Momentum: Supertrend is a trend indicator based on the ATR (Average True Range). Enter when Supertrend flips but confirms only when MACD (Moving Average Convergence Divergence) agrees, and the volume is above average. It is a trend-following trade with a volume gate which is to avoid false signals.
- S3 — Bollinger Squeeze Breakout: Wait until the Bollinger Band width to compress into the bottom 20% (the “squeeze.”) Then trade the explosive breakout.
- S4 — Opening Range Breakout: Defines the high and low of the first 45 minutes after the market opens. Trade a breakout of that range, and aim for a profit target of 2x ATR.
- S5 — RSI + StochRSI Reversal: Enter when RSI (Relative Strength Index) is oversold and StochRSI’s K line crosses above D, confirmed by price touching the lower Bollinger Band.
Each strategy uses next-bar entry (if you get a signal in candle i, enter at open of candle i+1), Chandelier trailing stops (a stoploss value using highest high minus a multiple of ATR) and Mandatory EOD square-off (exit at end of the day, no overnight position holding — everything is closed before market close.
Transaction Costs : Brokage (₹30 per trade) + Exchange charges (0.01% of trade value).
The data: 6,677 front-month candles on 15-minute timeframe, January 6 to June 19, 2026.
The Results — One Winner, Three Failures, and One Catastrophe
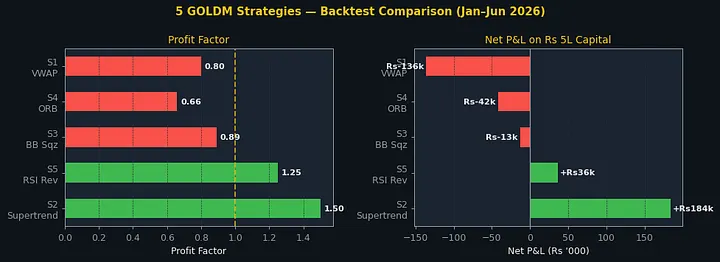
Profit factor above 1.0 means the strategy makes more than it loses. Two strategies cleared that bar.
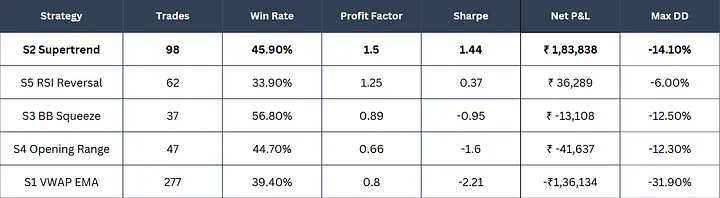
S1 turns out to be a real surprise but not in a good way. Starting with 277 trades is a lot. If ₹30/trade that is ₹8,310 of brokage alone before you add up exchange charges. Combine with a win rate which is below 50% and a 1.24 risk-reward ratio, results is ₹1,36,134 loss on a ₹5 lakh starting capital which is a brutal death by thousand cuts.
The risk-return picture makes the divergence even clearer:
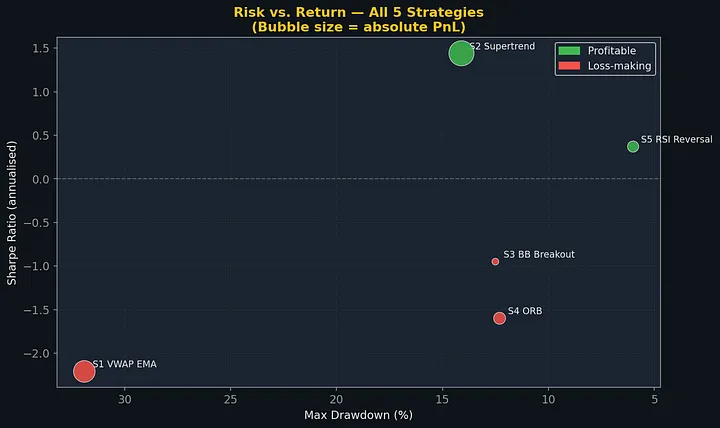
S2 sits alone in the top-right quadrant: high Sharpe, manageable drawdown. S1 is deep in the bottom-left.
S3 (BB Squeeze) had the highest win rate at 56.8% but the average loss was higher than the average win (Risk-Reward = 0.68). More wins doesn’t matter when your loss is higher than your profit. You cannot rely only on win rate. If your winners are small and losers are large, you go broke and lose money. This is where most retail traders fall into.
Lets Dig Into the Winner : Supertrend Momentum
S2 is the winner. Let me explain with a clear reason. It doesn’t trade constantly, only 98 trades over 5.5 months, which is about 4–5 trades per week. Each trade only happens when three things agree:
- Supertrend must flip direction (trend change)
- MACD confirms (momentum agrees)
- Volume (must be at least 1.2x the recent average)
That volume alone will eliminate a lot of low conviction entries.
def s2_long(d):
    flip = (d["supertrend_dir"] == 1) & (d["supertrend_dir"].shift(1) == -1)
    return flip & (d["macd"] > d["macd_signal"]) & (d["volume_ratio"] > 1.2)
Three signals, you take a trade when all three conditions are true. Supertrend acts as a direction filter, it uses ATR to determine which side of the trend you should be trading. MACD confirmation prevents you from entering counter-trend flips that happen in choppy/sideways markets. The volume filter requires at least 1.2× average volume, which blocks trades during thin sessions when spreads are wide and fills are poor.
Best performing session : Evening (post 2pm).
Best day of week : Thursday
I had expected the morning session to perform well but the data showed me the opposite.
The 6-Month P&L Walk: Where the Money Was Made (and Lost)
Now this is the part I care about the most. What actually happened Month-by-month with ₹3 lakh starting capital and 1 lot per trade
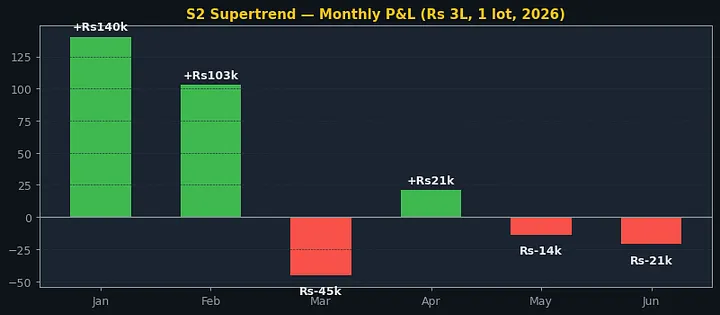
January and February paid for everything. March, May, and June gave some back.
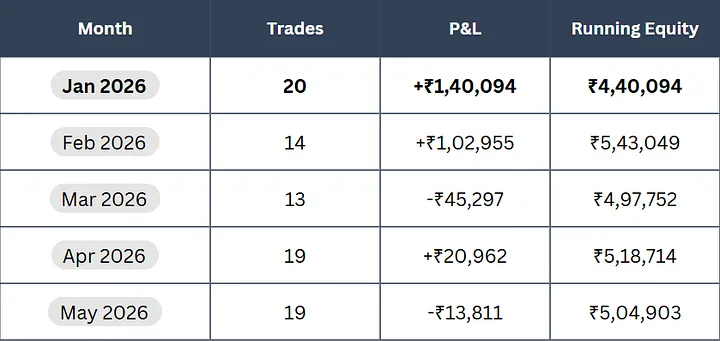
Final Performance : starting the capital with ₹3L grew into ₹4.84L in 5.5 months.
January was an extraordinary month. Gold had a strong directional run, and the Supertrend + momentum combo captured it perfectly. ₹1.4L profit in one month on a ₹3L capital is something unusual and I wouldn’t expect this on every month.
March went bad. Market was ranging, no clear trends. In such cases Supertrend flips constantly and each flip costs a transaction. That’s the fundamental weakness of any trend-following system, and this one is no exception.
Here’s every individual trading day:
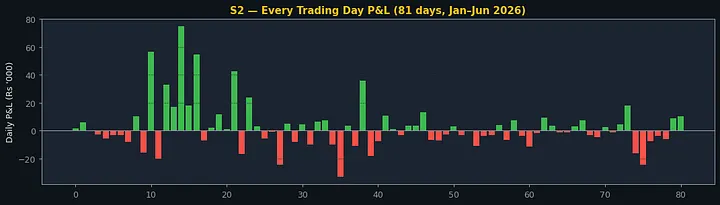
Green = profit day, red = loss day. 38 green, 43 red — fewer winning days than losing, but the wins were bigger.
This is where it’s hard to get emotionally prepared for: 38 winning days versus 43 losing days. You are losing more than you win. If you are watching it day-to-day without knowing the system’s overall edge, you will turn it off in March.
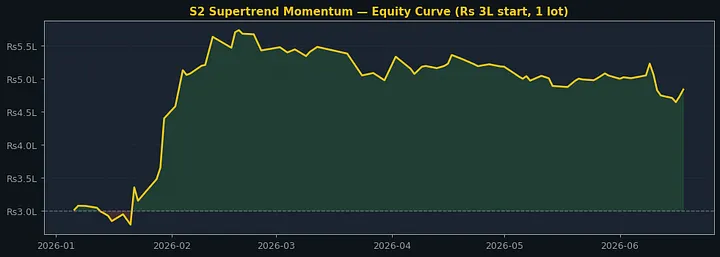
The equity curve — two months of strong gains, then a slow grind lower that still ended well above start
The max drawdrown was -14.1%. Meaning the portfolio fell ₹77,000 from its highest point. If you started at ₹3L , grew to ₹5,43,049 in February and then watched it drop to ₹4,65,000 by March. Can you hold on to it? That is the real challenge when it comes to trading. It test’s your discipline.
What I Got Wrong (The Gotachas That Cost Time)
- Continuous intraday data issue — MCX doesn’t provide continuous intradata data. I have wasted 2 hours trying to pull “continuous=true” 15-min GOLDM candles for 2 years. You get per-contract data, so you have to manually stitch the front-month roll yourself.
- pandas-ta installation problem — the pandas-ta library doesn’t install Python 3.10. I had written every indicator call written against pandas-ta only to realize it wouldn’t work. Then, I ended up rewriting all 12 indicators from scratch in pandas/numpy. Even though this cost me time, I understood the exact formulas behind every signal that I’m using.
- Look-ahead bias is everywhere — The original trend filter had a one-line bug, it uses the same bar’s close to decide entry which means the entry decision already knew the close. The fixed version lags by one bar (decision on prior bar, entry on next)
The backtest return dropped from 1,065% (biased) to +317% (realistic).
Look-ahead bias makes any system look brilliant but it will fail in live trading.
# Wrong — decision and entry use same bar
in_trend = df["close"] > df["sma200"]

# Right — decision made on prior bar, entry on next
pos = np.concatenate([[0], (df["close"] > df["sma200"])[:-1].astype(int)])
Only one line. The difference between a fake +1,065% and an honest +317%.
The Honest Verdict : Is S2 Tradeable?
The answer is “maybe” but only with your eyes open.
S2 gave strong results over 5.5 months, but the sample size is small. Two months (January and February) carried the entire outcome — that’s concentration risk. If the test had started in March, the results would look much worse. GOLDM trends well when global risk events and USD moves align, but it grinds when they don’t.
What the data supports: S2 has a genuine edge on cost‑adjusted returns, with a Profit Factor of 1.50 and a Sharpe Ratio of 1.44 (risk‑adjusted performance is decent), measured correctly without look‑ahead bias. The volume gate and triple‑confirmation filters keep trade frequency low, so costs don’t kill the performance.
What it doesn’t tell you: This is based only on recent intraday data that covers 5.5 months. What it doesn’t prove is whether S2’s edge holds in other years like 2023 or 2024, or any year that isn’t dominated by a January parabolic move in gold prices. The next step is out‑of‑sample validation across multiple years of data, which requires the daily continuous series (available back to 2012) rather than just the short recent intraday data I used here.
Guess What's Next
Now, I’m testing this on BANKNIFTY — more liquid, with more intraday data, and leverage that makes the P&L move faster. I’ve also built a reinforcement learning agent that learns to trade from the same features, but the agent didn’t generalize; it simply memorized January 2026. That turned into a different kind of lesson.
Warning! Data: MCX GOLDM 15-min front-month, Jan 6 -Jun 19, 2026. Starting capital: ₹5,00,000 for backtest comparison; ₹3,00,000 for S2 day-wise P&L. 1 lot per trade. Costs: ₹30 brokerage + 0.01% exchange charges. This is a personal research exercise, not investment advice. Backtests do not guarantee future performance.
Question for you guys:
Have you back-tested any strategy that looked great on paper but fell apart in live trading? What was the look-ahead bug?
Comment your answers, I would love to look at them.